Data visualization is the process of representing data or information in a graphical or visual format, such as charts, graphs, maps, and plots. The goal of data visualization is to communicate information clearly and effectively through visual means. It can be used to explore and understand data, identify trends and patterns, and communicate findings to others. There are many different types of data visualization, including bar charts, line graphs, scatter plots, and maps, and each type is best suited to different types of data and use cases. Data visualization can be used in a variety of fields, including business, science, engineering, and journalism, to name just a few.
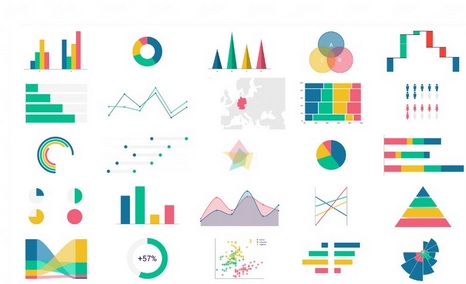
Here is a cheat sheet for data visualization that provides a quick reference for some common types of charts and graphs, along with tips on when to use each type:
- Bar charts: Used to compare categorical data or show changes over time.
- Line graphs: Used to show trends or patterns over time.
- Scatter plots: Used to show the relationship between two numerical variables.
- Pie charts: Used to show the proportions of a whole.
- Histograms: Used to show the distribution of numerical data.
- Box plots: Used to show the distribution of numerical data and identify outliers.
- Heat maps: Used to show the relationship between two categorical variables or the intensity of a third numerical variable.
- Tree maps: Used to show the hierarchical relationship between categorical variables and the proportions of a whole.
- Choropleth maps: Used to show spatial data and variations within regions.
- Bubble charts: Used to show the relationship between three numerical variables.
When creating a data visualization, it’s important to choose the right type of chart or graph for your data and the message you want to convey. It’s also important to consider the audience and how they will interpret the visualization. Finally, be sure to use clear labels, axis titles, and other visual elements to make the visualization easy to understand.